Loading…
#data visualization

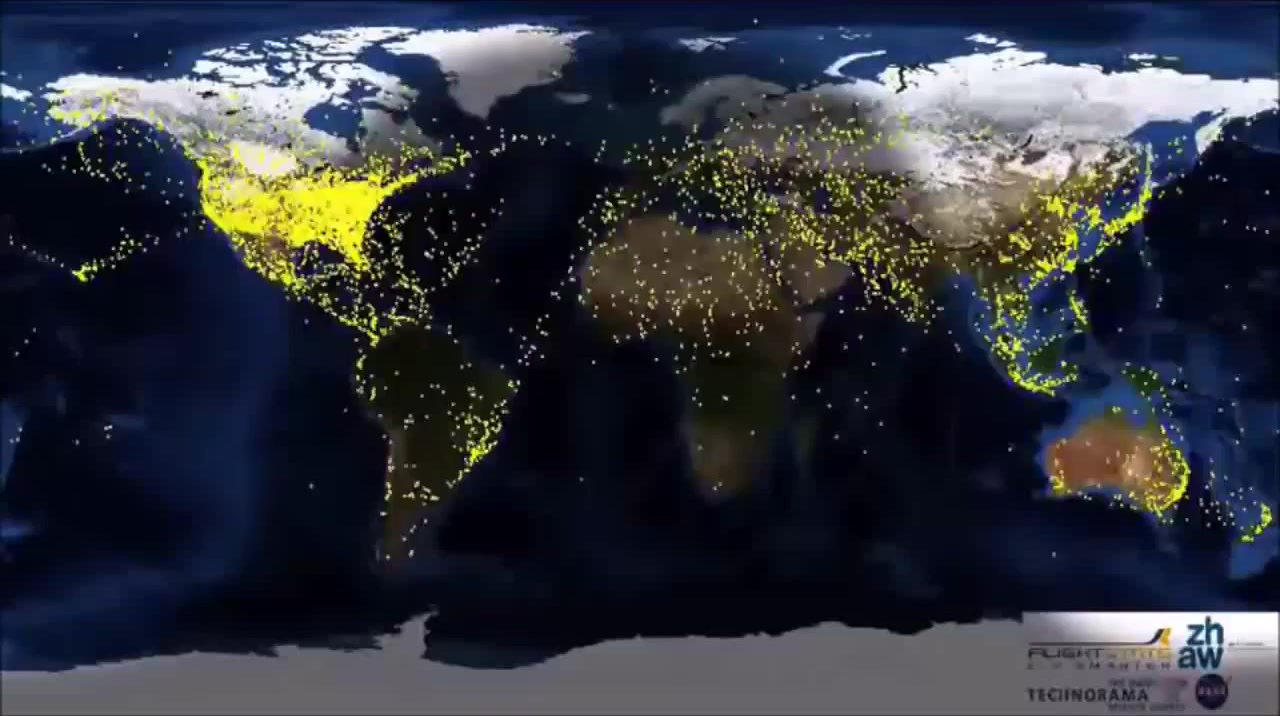
72 Hours of Global Air Traffic in 13 seconds

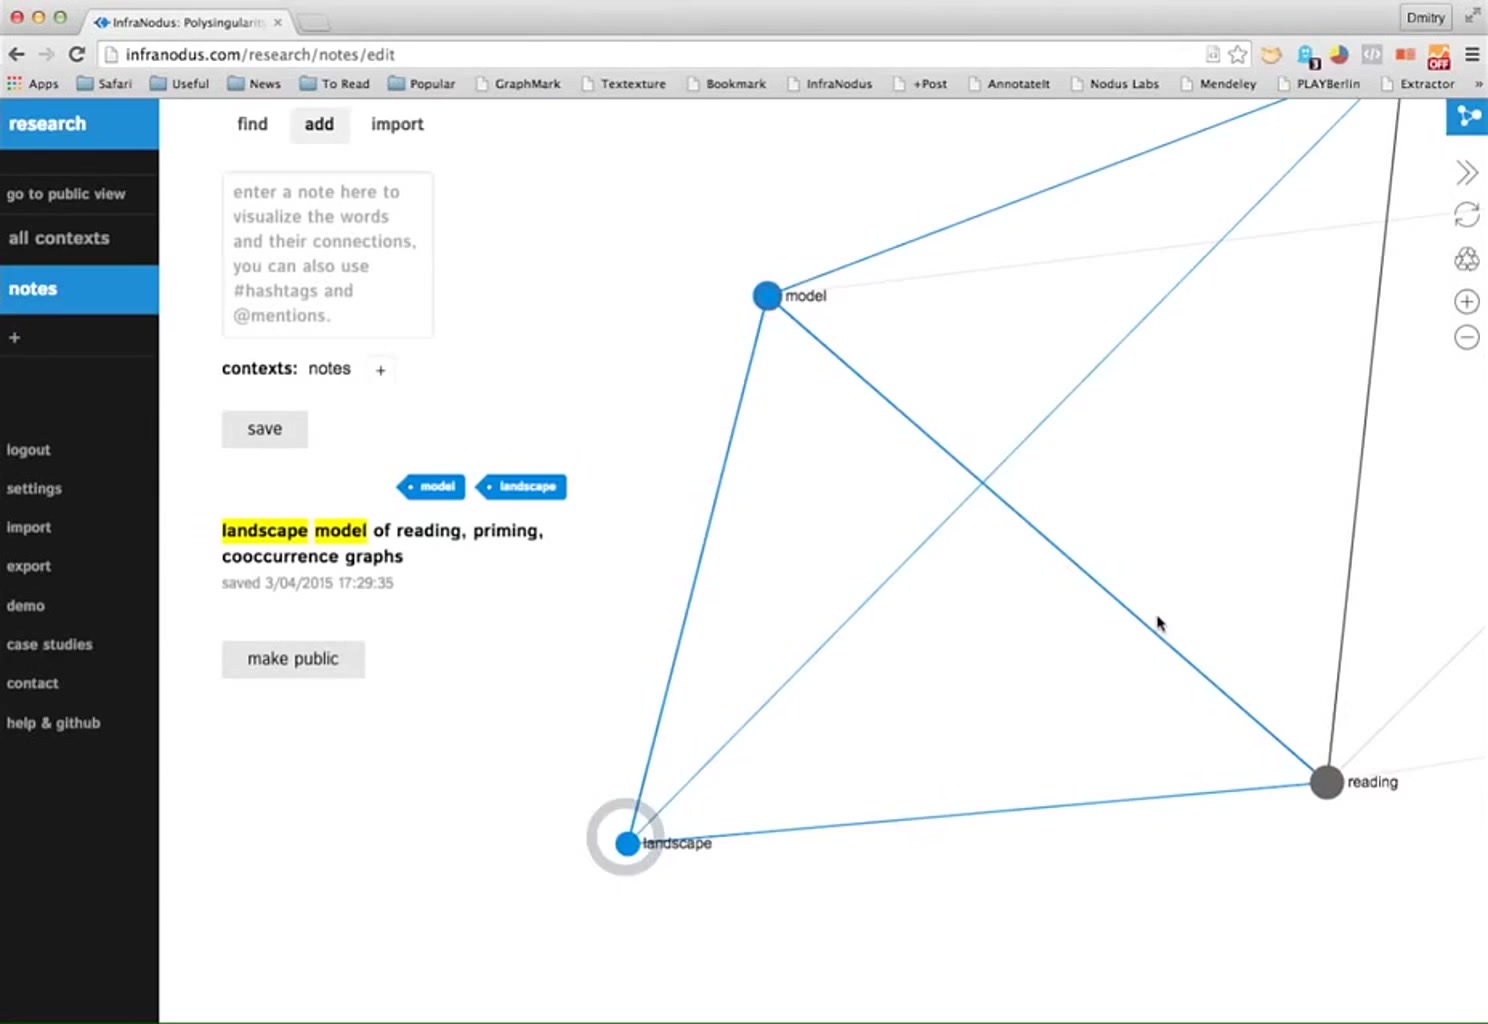
InfraNodus: Save the most interesting stuff from the net as a graph




The State of Wikipedia


How I Met Your Mother - Pie Chart Bar Graph
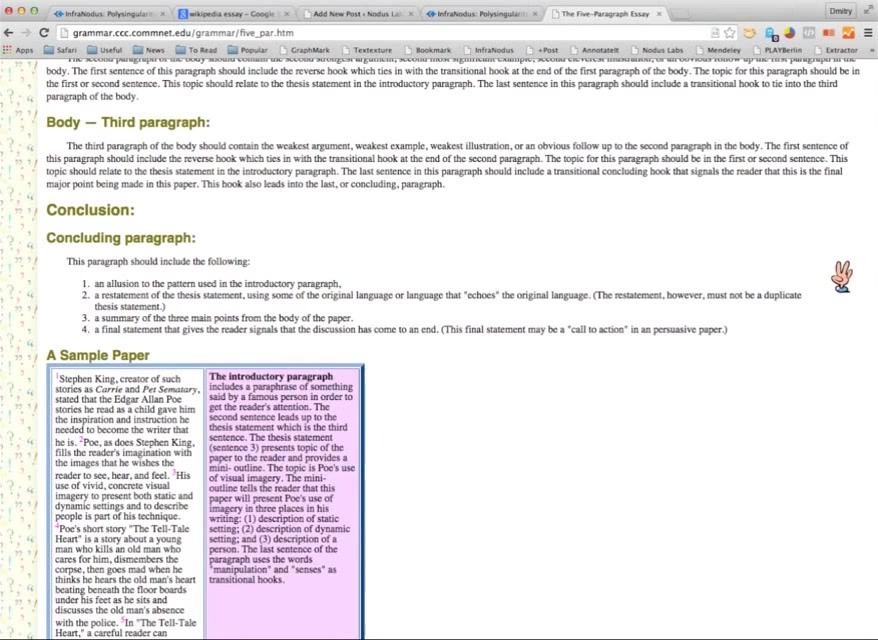
Using InfraNodus to keep track of your research notes from all over the web

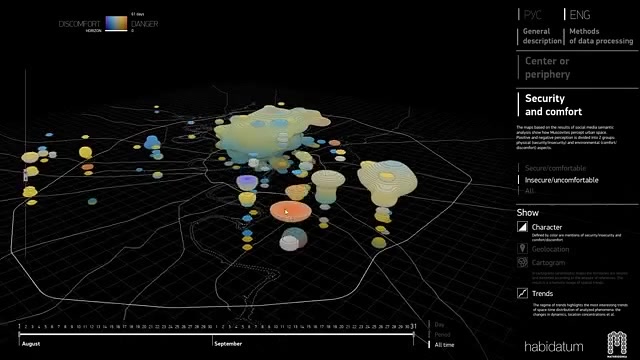
EMOTIONS: Muscovites’ Mental Geography


Giant Glove Jackson


Future World Population by Country in 2077s


The Fallen of World War II


Field of Vision - Best of Luck with the Wall

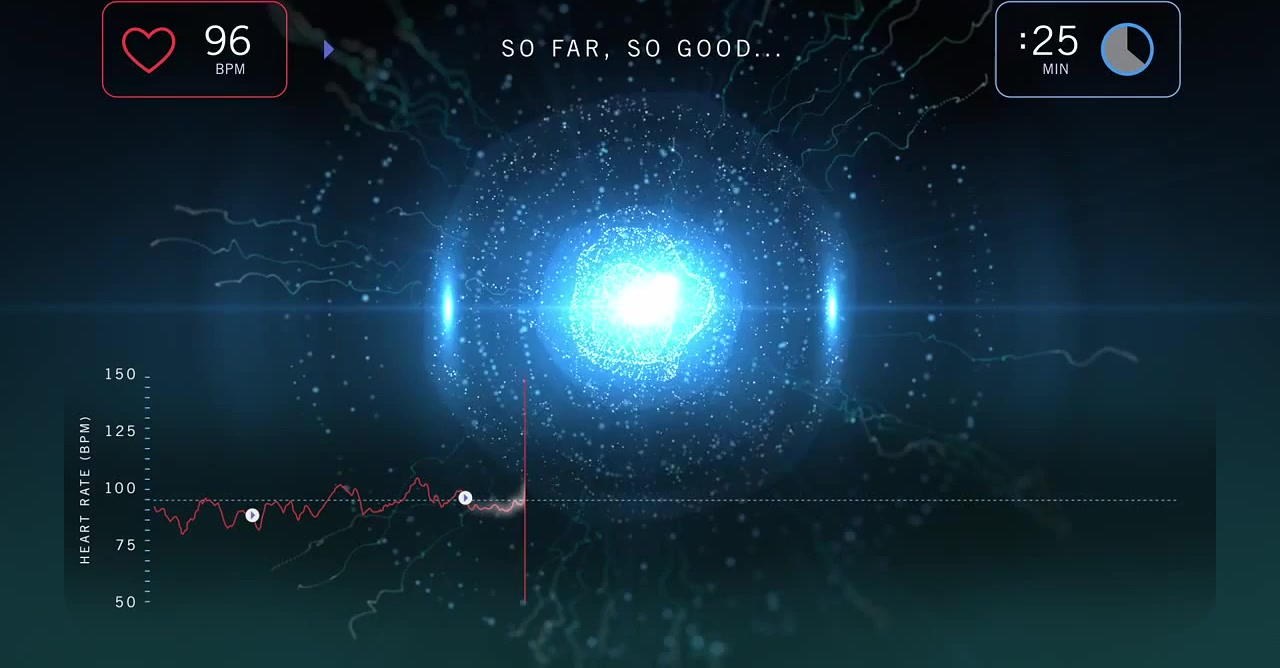
So Far So Good


CSIS Global Data Chandelier

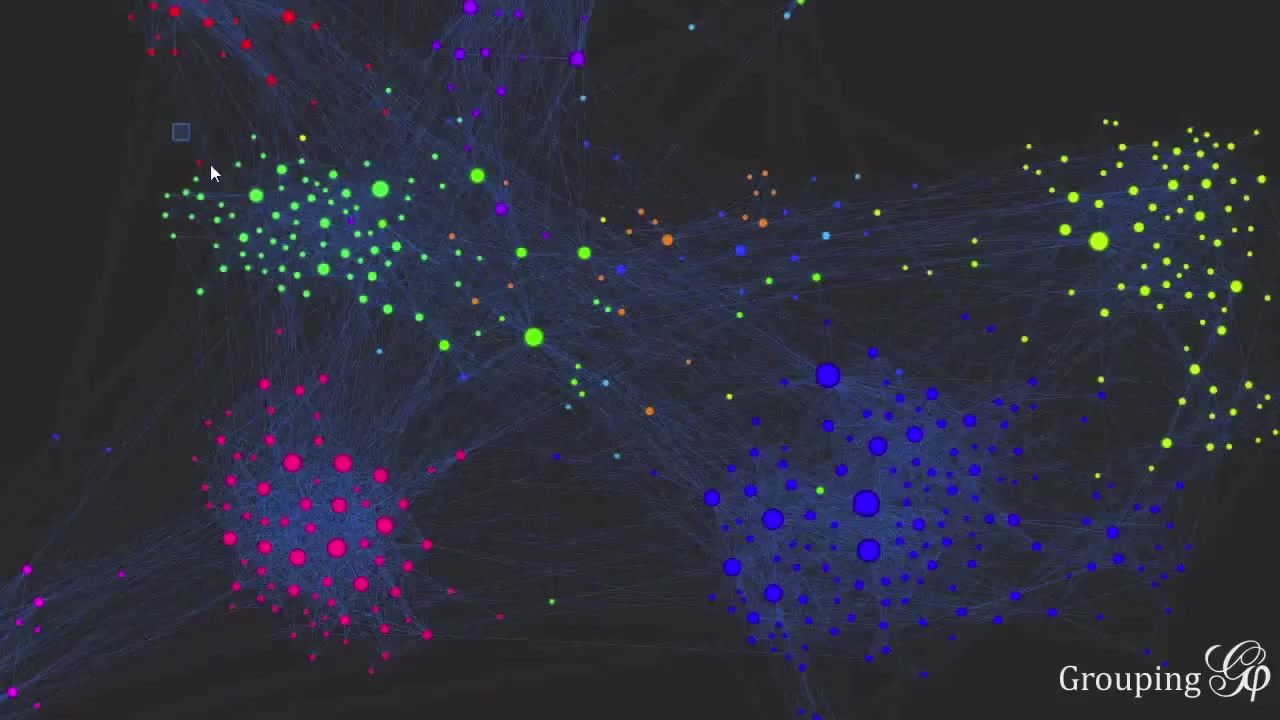


Community Ownership | Coming Soon


Saunder's Plot