Loading…

Click to Unmute
- Restart
- Copy link

Corona
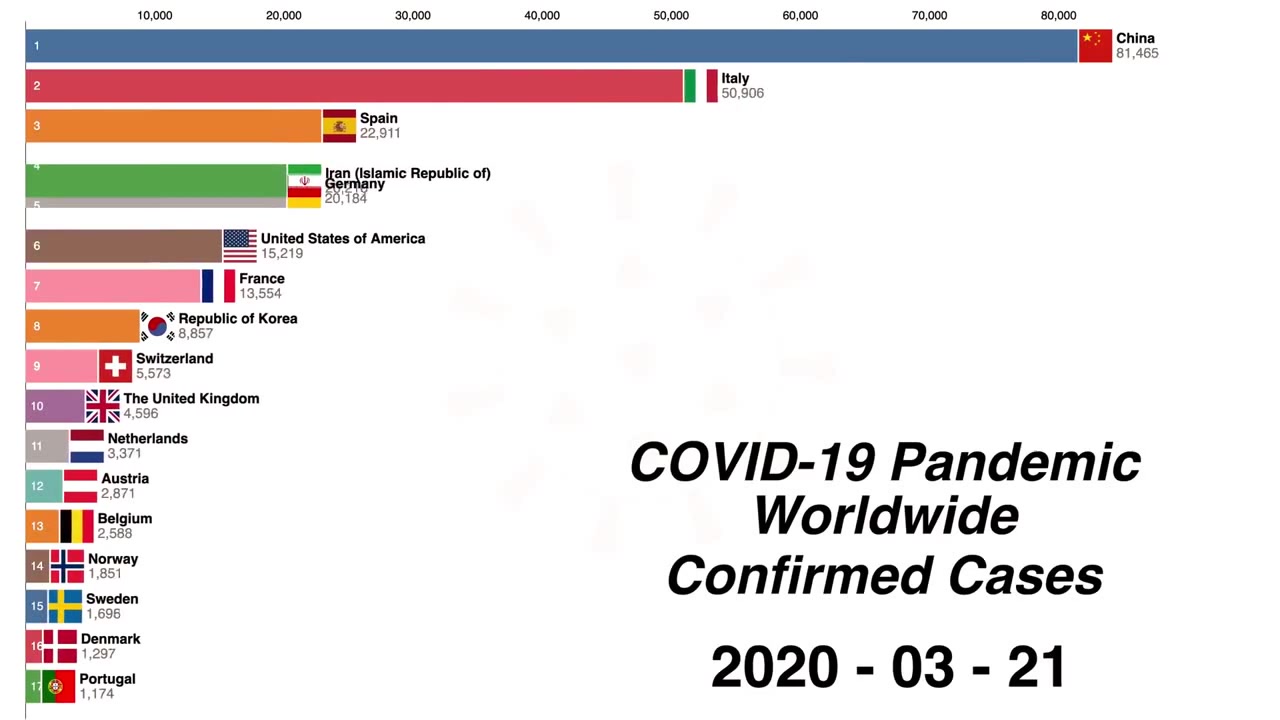
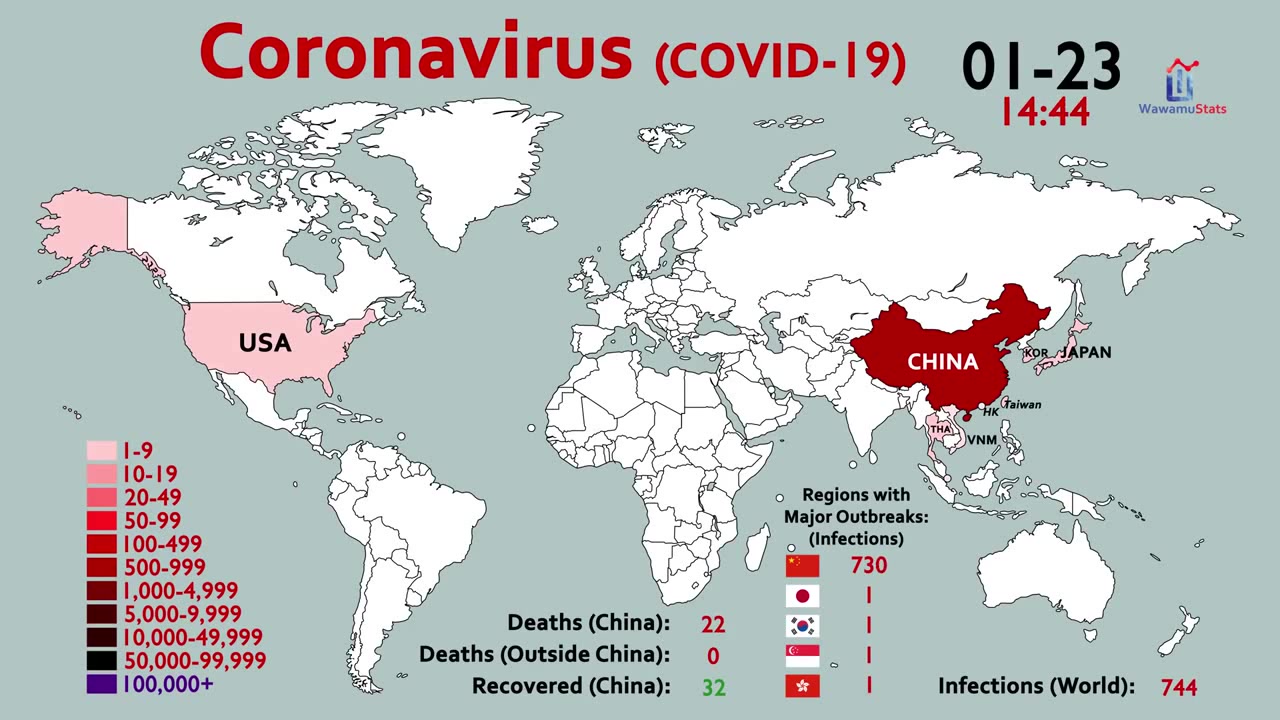
Description
A horizontal bar chart displays the number of confirmed cases of a disease, with the bar for China extending progressively to the right across a series of daily updates from January 22 to January 26, indicating a rapid increase in cases. The chart also lists other countries with smaller bars, and a summary in the lower right corner shows the total number of cases worldwide, deaths, and recoveries, which all increase daily.

Similar coubs



Corona
Be the first to share your thoughts!