Loading…

Click to Unmute
- Restart
- Copy link

hi
Description
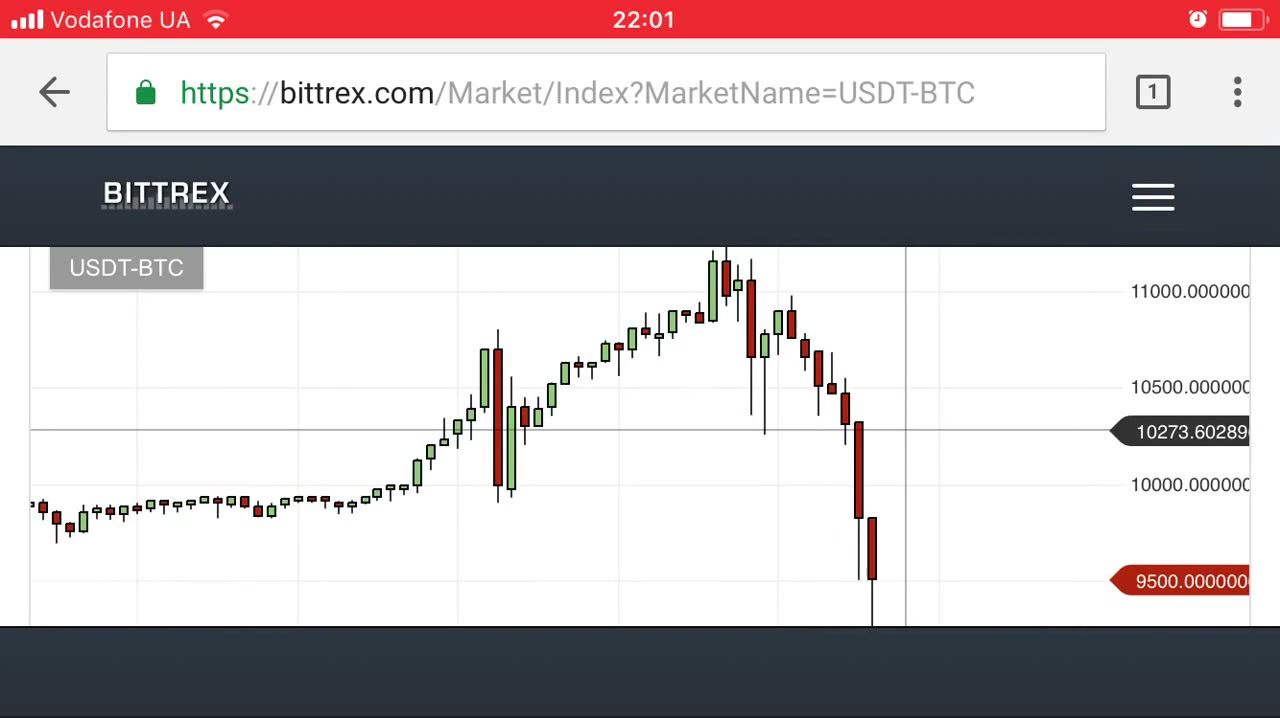
a financial candlestick chart for the USD/MXN (OTC) currency pair, where the price initially trends downward, then experiences a sharp upward reversal, followed by a period of volatility and a subsequent decline. The chart is set against a dark background with various trading interface elements, including a time axis, price levels, and a pending trade indicator.

Similar coubs




hi
Be the first to share your thoughts!