Loading…
Click to unmute
- Restart
- Copy link

CTA Prototype Telescope Achieves "First Light"
Description
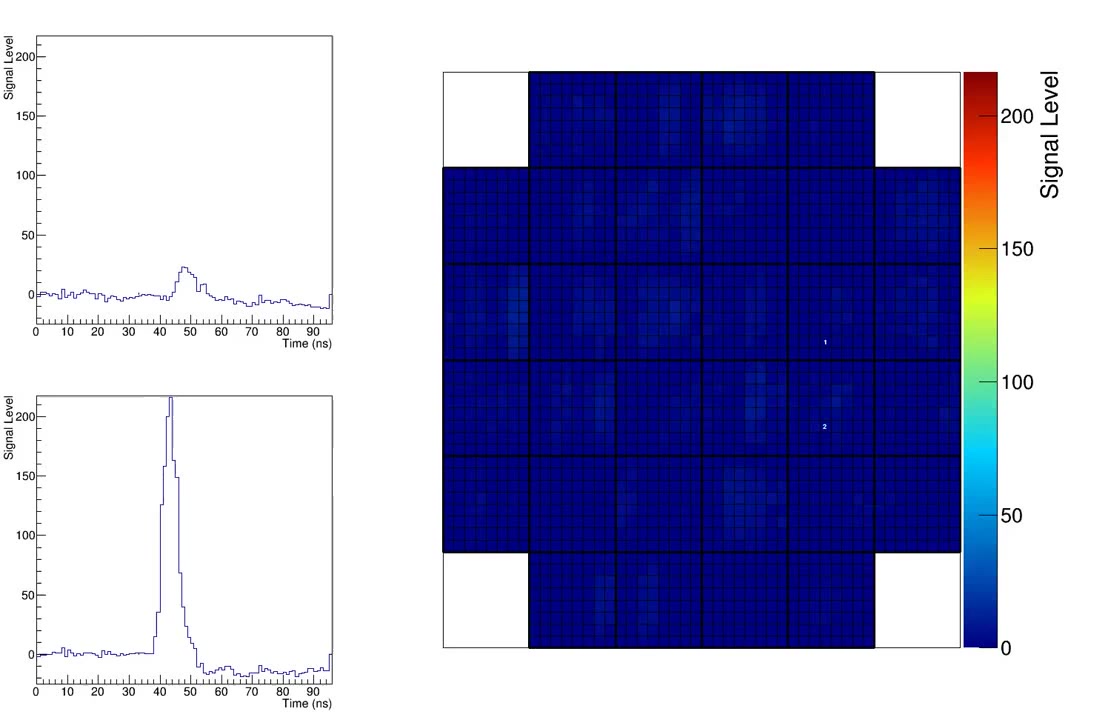
Two line graphs on the left plot signal intensity over time, with a sharp peak in the lower graph. On the right, a 2D color map displays signal level across a grid, where a bright yellow spot appears and then fades, indicating a localized signal event.

Similar coubs


CTA Prototype Telescope Achieves "First Light"
Be the first to share your thoughts!